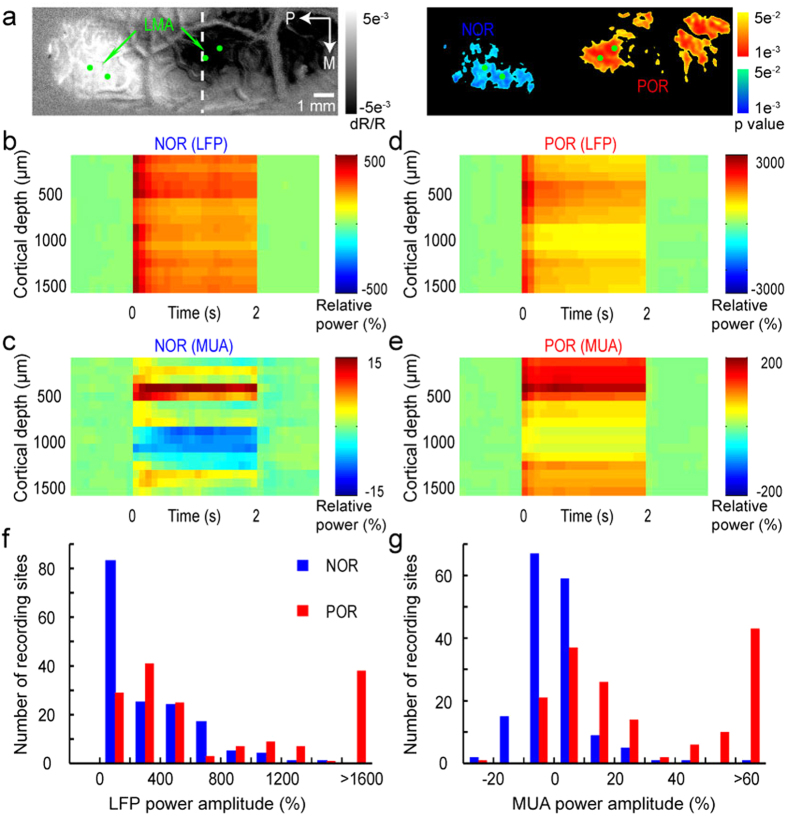
Figure 6. LMA recordings of MUA and LFP by TcES (10 Hz, 1.2 mA, 3 ms) in one cat.
(a) Optical imaging map (530 nm) and corresponding P-value map (two-tailed t test, P < 0.05, n = 148 trials) of cortical activation. Green dots, locations of the LMA. (b−e) 30–130 Hz (LFP) and 300–2500 Hz (MUA) power response in 85-ms bins from LMA in the NOR and POR regions (the stimuli lasted for 2 s). The first 15 ms of each 100-ms data containing the electrical artifact was removed. The data were averaged over 200 trials. (f−g) Distributions of the MUA and LFP power changes (mean power within 2 s) in the NOR and POR regions from 5 cats (two insertion locations for each response region in one cat, 160 recording sites in total inside each response region in 5 cats).

