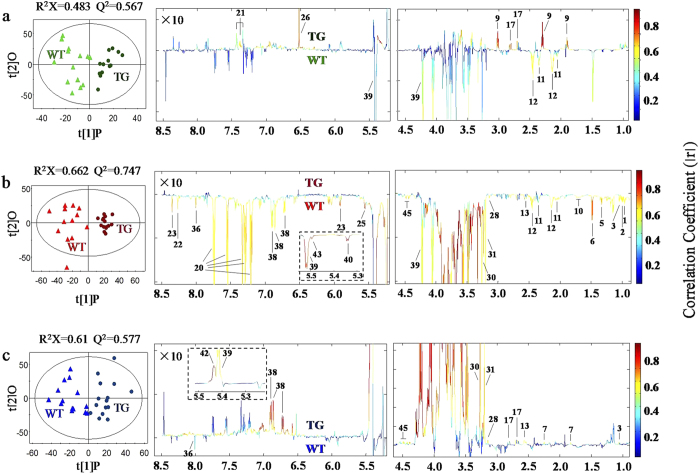
Figure 2. OPLS-DA scores plots (left) and coefficient-coded loadings plots (right) showing time-dependence of anti-trx-s gene effects on wheat seed metabolism.
These models were derived from transgenic wheat (TG) and wild type (WT) seeds (a) at 30-dpa (p = 0.0007), (b) 40-dpa (p = 0.000001) and (c) 30-dpr (p = 0.0003). Metabolite keys are the same as in Fig. 1 and Table S1.

