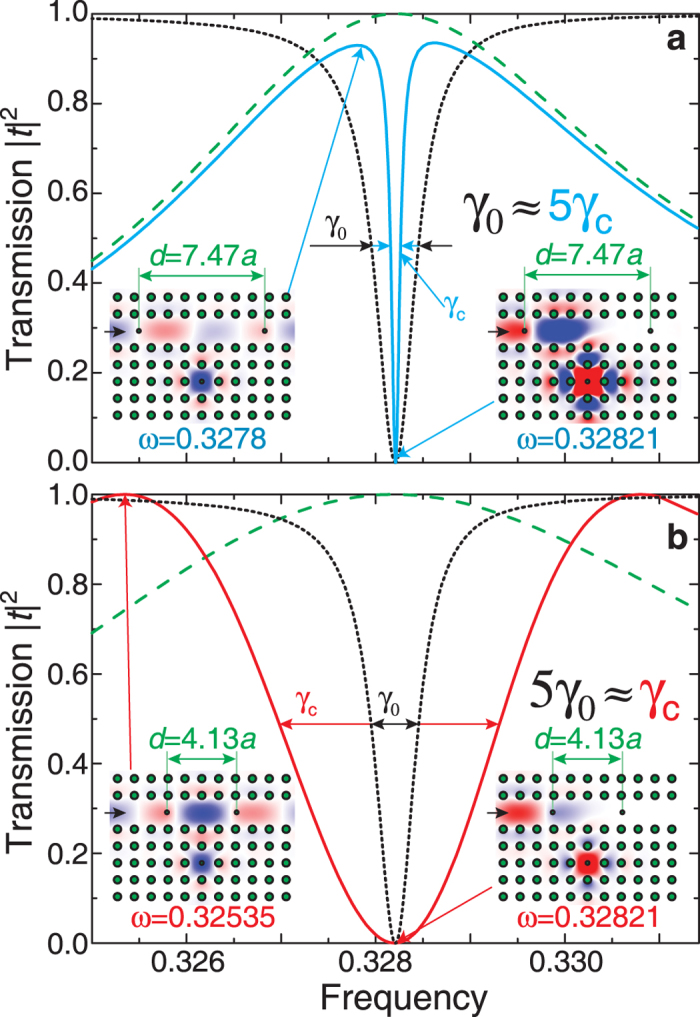
Figure 4. Manifestation of the Purcell effect in photonic-crystal waveguide with a cavity.

(a) An increase of the lifetime. The transmission spectrum of the structure without FPR (black dotted curve)  and FPR only (green dashed curve) at
  . The spectrum of the complete structure is shown by a blue solid curve,
  . (b) A decrease of the lifetime. The transmission spectrum of the structure without FPR (black dotted curve)
  and FPR only (green dashed curve) at
  . The spectrum of the complete structure is shown by a red curve,
  . Inserts show the
  field distributions for the indicated frequency values.
