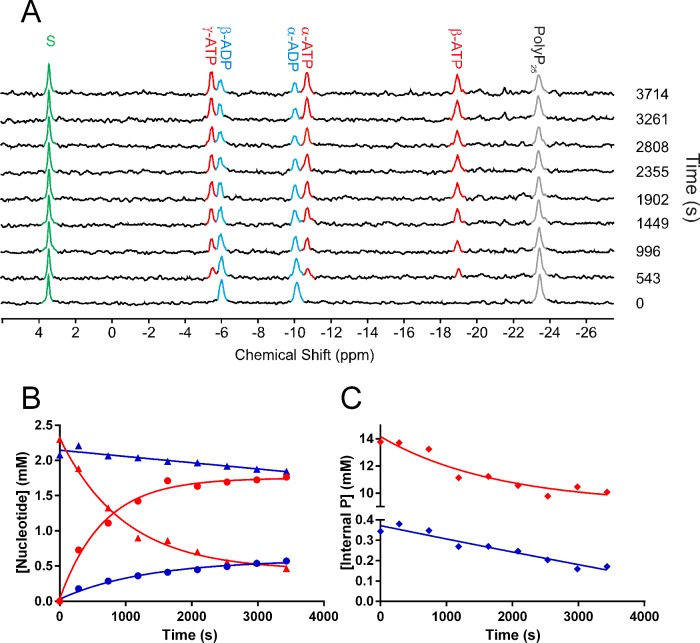
Figure 5. Kinetic analysis of FtPPK2 catalysed reactions using 31P-NMR.
(A) Time course for a FtPPK2 reaction monitored by 31P-NMR. In this example reaction, initial conditions were: 2 mM ADP, 125 μM polyphosphate, 2 mM dCMP and 150 nM FtPPK2. Peaks were assigned as follows: 3.44 (dCMP),–5.44 (γ-ATP),–5.94 (β-ADP),–10.07 (α-ADP),–10.72 (α-ATP),–18.96 (β-ATP),–23.39 (polyphosphate internal phosphoanhydride); peaks are coloured as follows: ATP: red; ADP: blue; polyphosphate internal phosphoanhydride: grey; dCMP: green. (B) Kinetics analysis of 31P-NMR time course experiments for two nt concentrations. Experiment 1 (initial [polyphosphate]=500 μM); ATP: red circles, ADP: red triangles. Experiment 2 (initial [polyphosphate]=16 μM); ATP: blue circles, ADP: blue triangles. (C) Kinetic analysis of 31P-NMR time course experiments for changes in internal phosphoanhydride in polyphosphate. Red: experiment 1; blue: experiment 2. The spectrometer (Bruker 400 MHz, operating at 161 MHz for 31P-NMR) was maintained at 37°C for the duration of the experiment.

