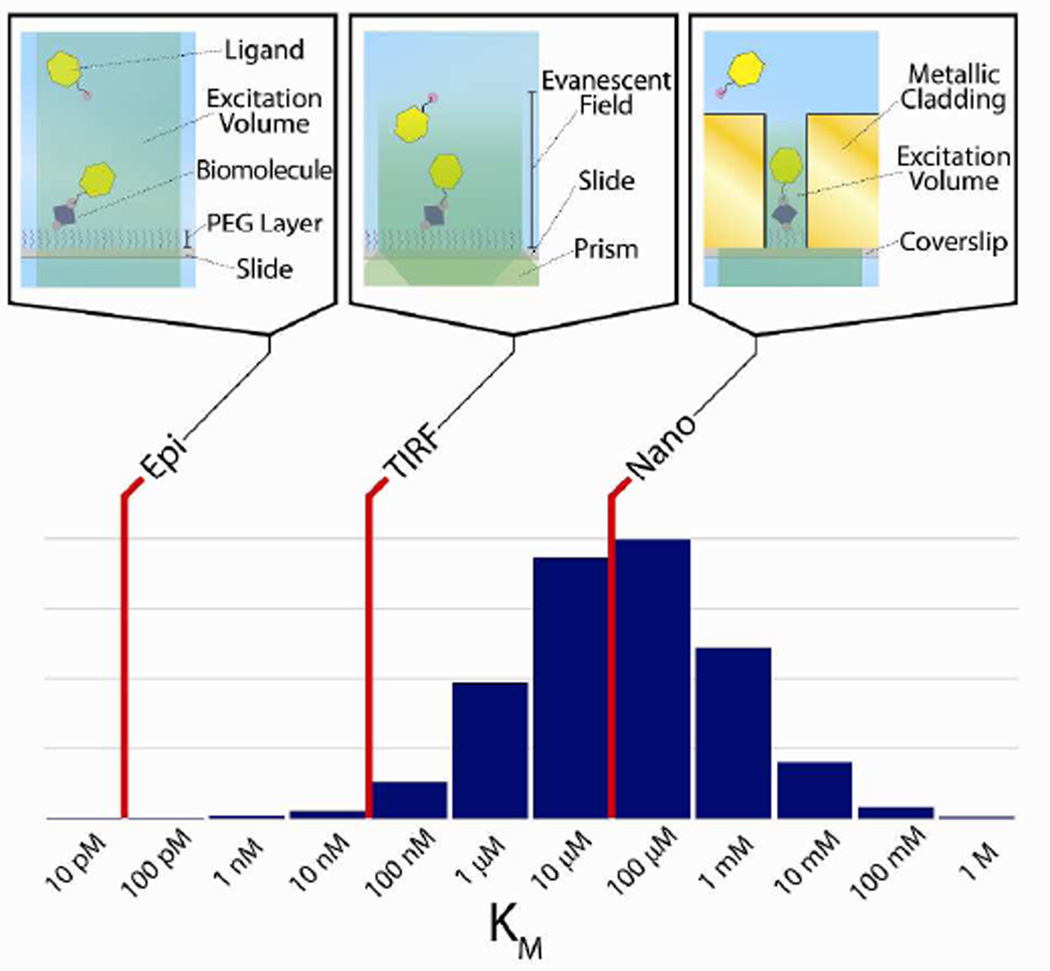
Figure 1.
Diagram of concentration ranges accessible by various microscopy techniques. Red lines represent the upper limit of the background concentration of ligand biomolecules that can be employed in smF experiments using epi-fluorescence microscopy (Epi), TIRF microscopy (TIRF), and nanoaperture fluorescence microscopy (Nano). The microscope schematics connected to each red line provide molecular-level diagrams corresponding to each technique (upper panel). The histogram shows the distribution of Michaelis constants (KM), a characterization of the interactions between enzymes and their corresponding substrates, of all eukaryotic enzymes in the BRENDA enzyme database.14 This distribution is analogous to the distribution of background concentrations of ligand biomolecules required to observe interactions with a target biomolecule on an experimentally accessible timescale using smF microscopies (lower panel).

