
Figure 3.
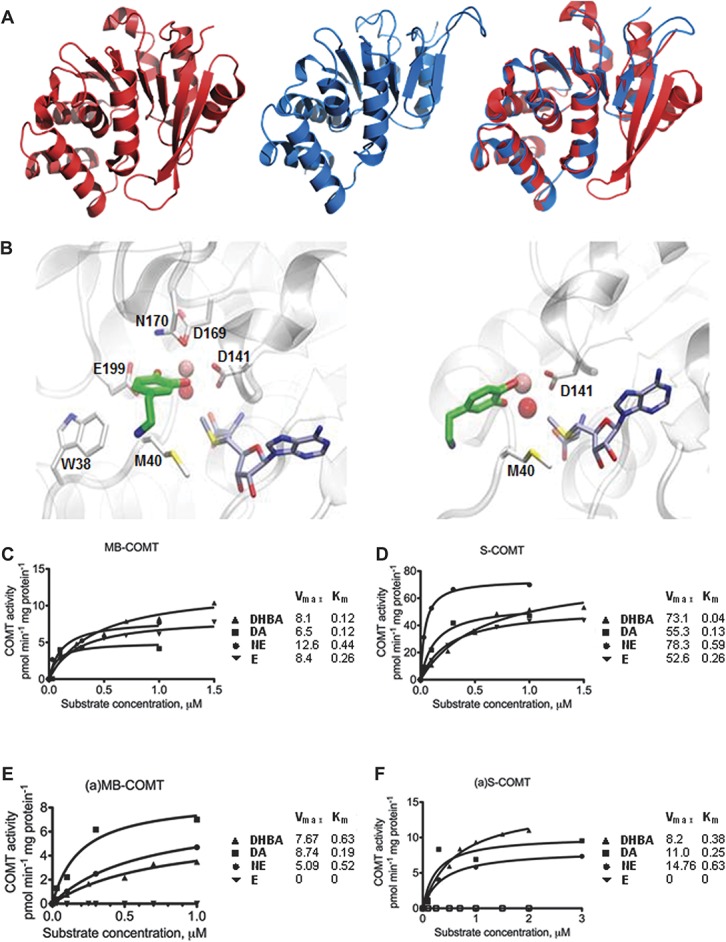
Predicted (a)S-COMT crystal structure and docking poses of dopamine and measured substrate concentration–COMT velocity curves. (A) Crystallographic structure of S-COMT (red), computationally determined structural model of (a)S-COMT as extracted from DMD simulations (blue), and superimposition of both. (B) Zoomed view of best dopamine docking solutions for S-COMT and (a)S-COMT (carbon atoms of ligands, SAM, and (a)S-COMT residues are represented in green, grey, and white, respectively. Catalytic Mg2+ ion and Mg-coordinating conserved water molecule are represented as a pink and red sphere, respectively; see Supplementary Table S7 (available online as Supplemental Digital Content at http://links.lww.com/PAIN/A120) for chemical structures of catecholamines and docking energy values). (C-F) Cell lysates from Be2C cells transfected with vectors expressing (C) MB-COMT or (D) S-COMT, or their alternative counterparts (a)-COMT isoforms, (E) (a)MB-COMT or (F) (a)S-COMT were tested using DHBA, dopamine (DA), norepinephrine (NE), and epinephrine (E). The fitted kinetic values with 95% confidence limits are given in Supplementary Table S7 (available online as Supplemental Digital Content at http://links.lww.com/PAIN/A120).