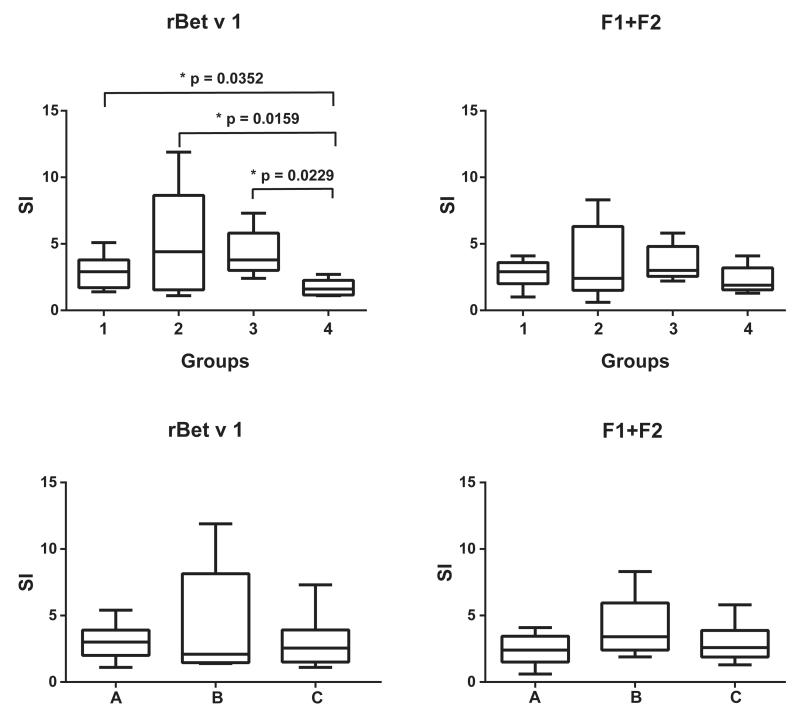
FIG 2.
T-cell proliferation toward rBet v 1 or F1+F2. Shown are PBMC proliferations (y-axes: stimulation indices as box-and-whisker plots showing minimum, quartiles, median, and maximum values) in response to rBet v 1 or the rBet v 1 fragments (F1+F2) for study groups 1 to 4 (upper panel) and (lower panel) for patients with birch pollen allergy with positive APT reactions (group A), patients with birch pollen allergy with negative APT reactions (group B), and subjects without birch pollen allergy with negative APT reactions (group C). Significant differences between the groups are indicated.

