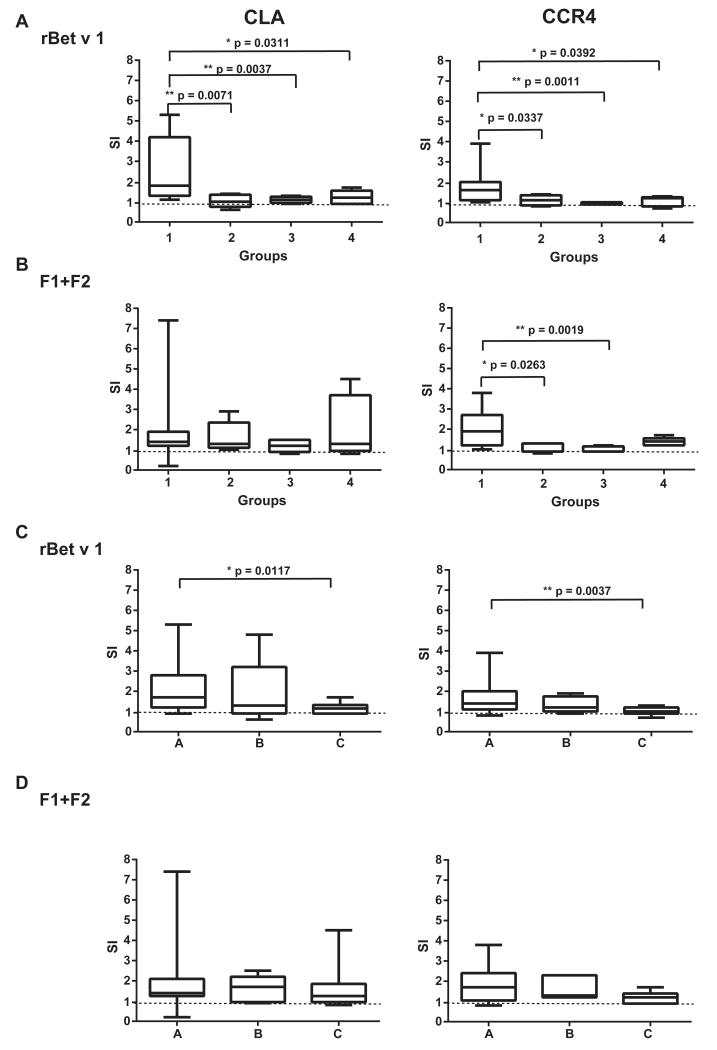
FIG 3.
Activation of CLA+ or CCR4+CD3+ cells by rBet v 1 or F1+F2 with carboxyfluorescein diacetate succinimidyl ester staining. A and B, Shown are the stimulation indices as box-and-whisker plots showing minimum, quartiles, median, and maximum values in response to rBet v 1 (Fig 3, A) or to the rBet v 1 fragment mix (F1+F2; Fig 3, B) for study groups 1 to 4. C and D, Results for patients with birch pollen allergy with positive APT reactions (Fig 3, A), patients with birch pollen allergy with negative APT reactions (Fig 3, B), and subjects without birch pollen allergy with negative APT reactions (Fig 3, C) in response to rBet v 1 and F1+F2, respectively. Significant differences between the groups are indicated. The horizontal dashed line represents the cutoff for positive proliferation (stimulation index > 1).

