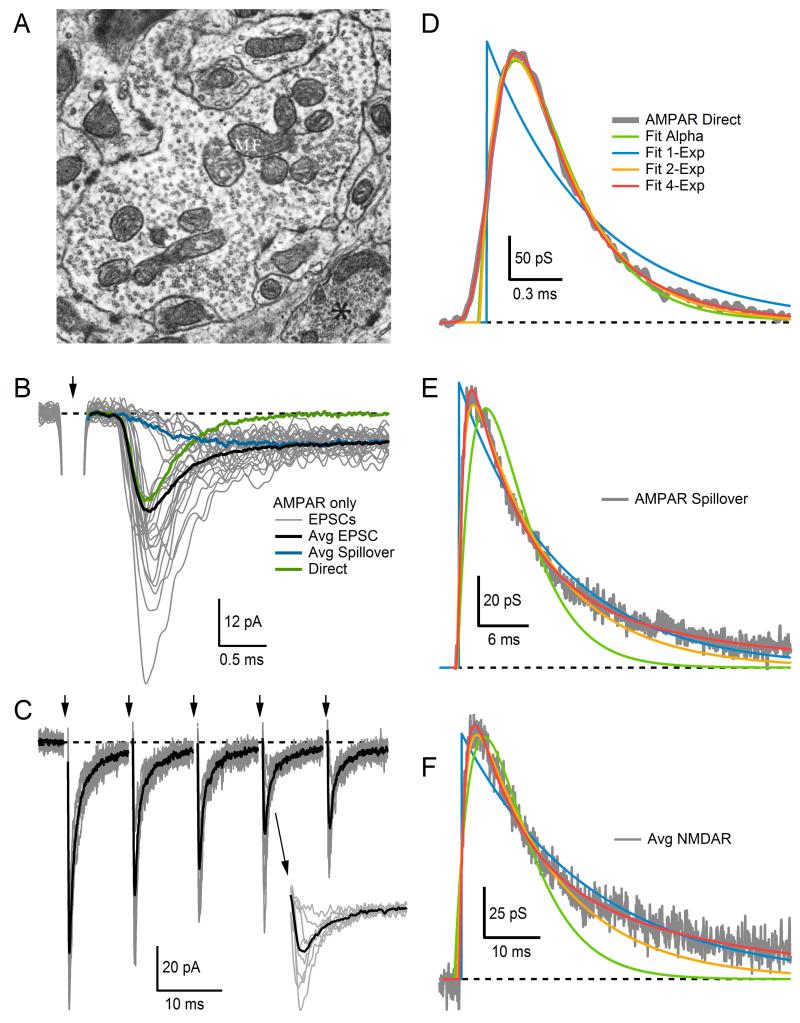
Figure 13.2. Synaptic transmission at the cerebellar MF–GC synapse.
(A) Electron micrograph of a cerebellar MF terminal filled with thousands of synaptic vesicles and a few large mitochondria. Synaptic contacts with GC dendrites appear along the contours of the MF membrane at several locations, evident by the wider and darker appearance of the membrane due to clustering of proteins within the presynaptic active zone and postsynaptic density. (B) Superimposed AMPAR-mediated EPSCs (gray) recorded from a single MF–GC connection, showing considerable variability in amplitude and time course from trial to trial. On some trials, failure of direct release revealed a spillover current with slow rise time. Such trials were separated using the rise time criteria of Ref. 24. The average direct-release component (green) was computed by subtracting the average spillover current (blue) from the average total EPSC (black). Arrow denotes time of extracellular MF stimulation, which occurred at a slow frequency of 2 Hz; most of the stimulus artifact has been blanked for display purposes. (C) Superimposed AMPAR-mediated EPSCs (gray) recorded from a single MF–GC connection and their average (black). The MF was stimulated at 100 Hz with an external electrode (arrows at top). Successive EPSCs show clear signs of depression. Inset shows EPSC responses to fourth stimulus on expanded timescale, showing the variation in peak amplitude. Stimulus artifacts have been blanked. (D) Average direct-release AMPAR conductance waveform (gray) fit with Gsyn(t) defined by the following functions: alpha (Eq. 13.5), one-exponential (Eq. 13.4), two-exponential (Eq. 13.6), multiexponential (4-Exp, Eq. 13.7). Most functions gave a good fit except the one-exponential function (blue). The conductance waveform was computed from the average current waveform in (B) via Eq. (13.3). (E) Same as (D) but for the average spillover component in (B). Most functions gave a good fit except the alpha function (green). (F) Same as (D) but for an average NMDAR-mediated conductance waveform computed from four different MF–GC connections. Again, most functions gave a good fit except the alpha function (green). Dashed lines denote 0. (A) Image from Palay and Chan-Palay25 with permission. (B) Data from Sargent et al.26 with permission.

