
Figure 7. Effect of WT or M2 mutant 5′UTR of CA16 on viral RNA synthesis and viral translational capacity in infected RD cells.
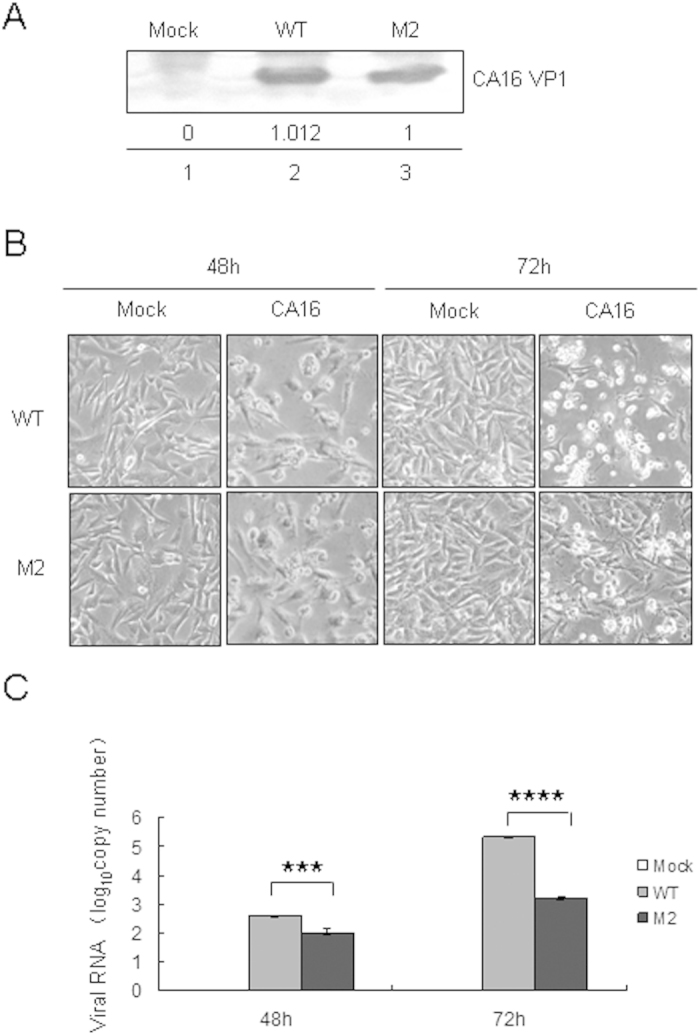
(A) Equal amounts WT and M2 viruses were determined using a VP1 antibody by immunoblotting analysis. (B) CPEs in RD cells induced by equal amounts of WT and M2 viruses were imaged via light microscopy at 48 h and 72 h after transfection. (C) Viral loads in the supernatant of RD cells were detected by RT-qPCR. The results represent at least three independent experiments. *P < 0.05, **P < 0.01, ***P < 0.001, ****P < 0.0001.