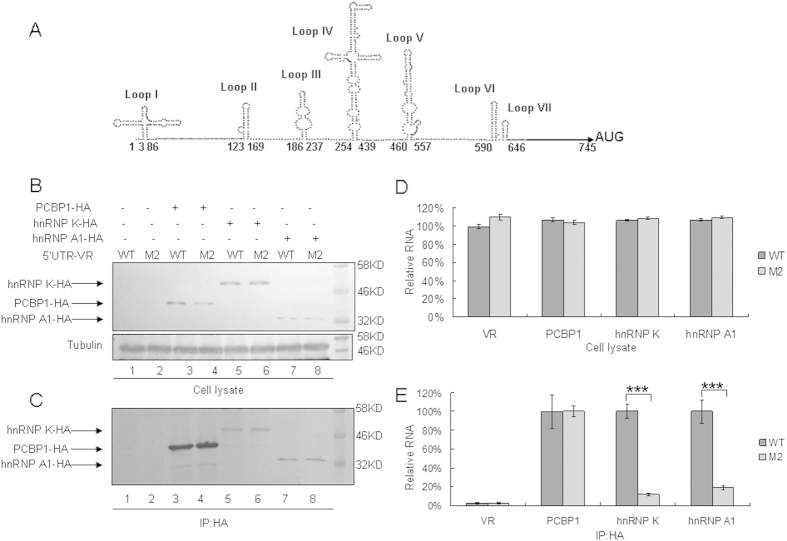
Figure 9. Interactions of WT or M2 mutant 5′UTR of CA16 with cellular proteins hnRNP K, hnRNP A1 and PCBP1.
(A) Structural prediction of CA16 5′UTR using Mfold software. The nucleotide change C104T is located at the linker between loop I and II. (B) Expression of cellular proteins after transfection with 5′UTR of CA16. VR1012, hnRNP K-HA, hnRNP A1-HA or PCBP1-HA was co-transfected with WT 5′UTR or M2 mutant expression vector into HEK293T cells. Cell lysate were prepared at 48 h after transfection. Part of each cell lysate was dissolved in 1 × loading buffer for immunoblotting analysis. (C) Immunoprecipitation assay. Most of each cell lysates was incubated with anti-HA agarose beads at 4 °C for 3 h. Following washing and dissociation, part of each bead pellet was re-suspended in 1 × loading buffer for immunoblotting analysis, and another part was used for RNA extraction. (D) RNA levels of CA16 5′UTR in cell lysates. RNA was extracted from a portion of each set of transfected HEK293T cells and then analyzed by RT-qPCR using primers specific for GAPDH RNA or CA16 5′UTR RNA. GAPDH was used as a control. The RNA level in the presence of VR1012 and WT 5′UTR was normalized to 100%. (E) Interaction of various cellular proteins with CA16 5′UTR. RNA extract from immunoprecipitation was subjected to RT-qPCR analysis with primers specific for CA16 5′UTR RNA. The RNA level in the presence of PCBP1, hnRNP K or hnRNP A1 and WT 5′UTR was normalized to 100%. The RNA level in the presence of PCBP1 and WT 5′UTR was normalized to 100% in the VR1012 negative control group. Errors bars represent the SD from triplicate wells within one experiment. Results represent at least three independent experiments. *P < 0.05, **P < 0.01, ***P < 0.001, ****P < 0.0001.

