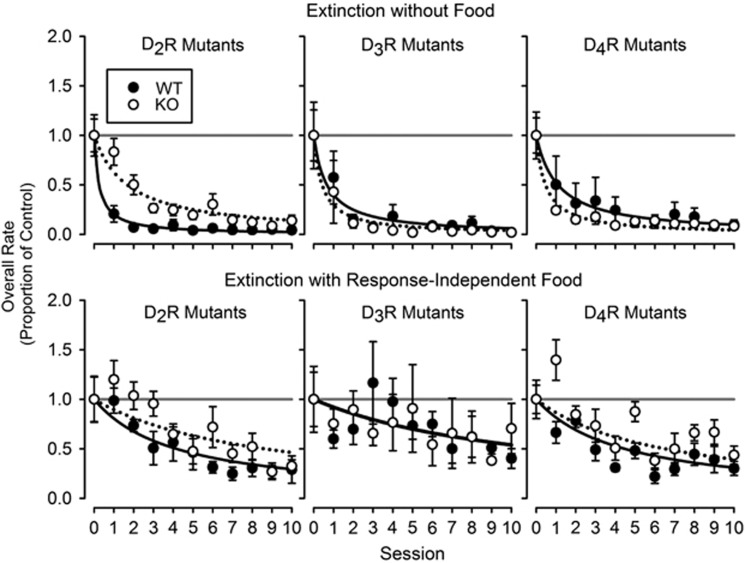
Figure 3.
Overall response rate as a proportion of control response rate during sessions of extinction without food (top row) and extinction with response-independent food (bottom row) for wild type and DA D2R (left), D3R (middle), and D4R (right) knockout subjects (n=6 per genotype except n=7 for D3R genotypes in extinction without food). Each data point represents the mean across subjects within a genotype. Error bars represent ±1.0 SEM. Solid and dotted lines in the bottom graphs represent best-fitting versions of the hyperbolic model of demand for the wild-type subjects and knockout subjects, respectively. Horizontal gray lines are for reference and indicate control response rates.

