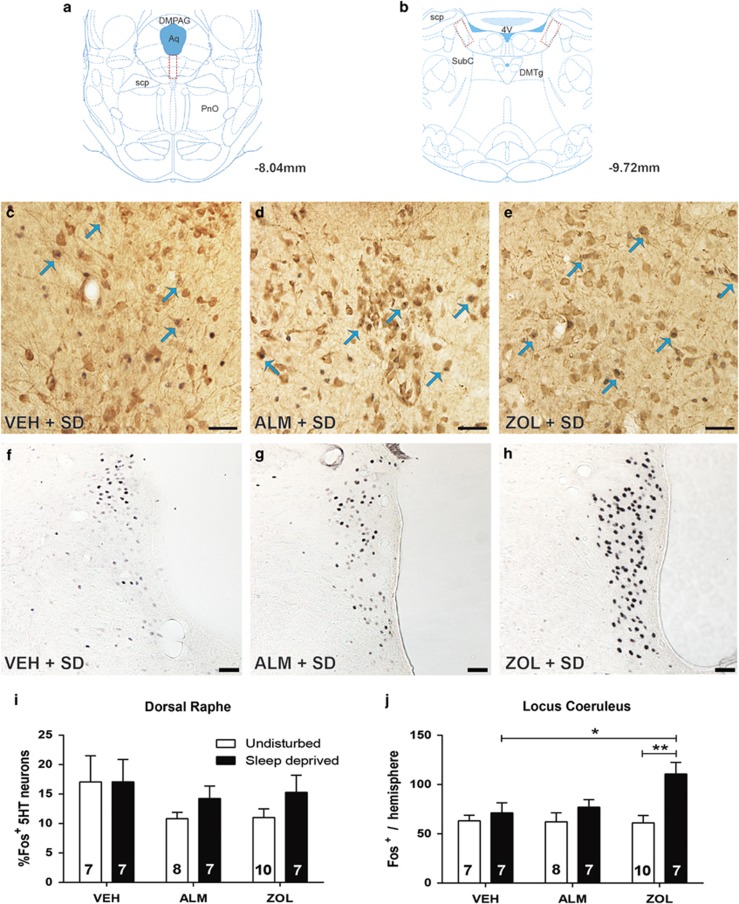
Figure 5.
Fos co-labeling with 5HT neurons in the DR and single-labeled Fos cells in the LC. (a–b) Boxes delineate the regions scored in the (a) DR and (b) LC. In (c–h) Fos-positive nuclei are small black dots and 5HT-expressing neurons have brown cytoplasmic reaction products. Blue arrows indicate examples of co-labeled neurons. Scale bar represents 50 μM. Representative image of 5HT and Fos expression in a sleep-deprived rat treated with (c) VEH, (d) ALM, or (e) ZOL. (f) Fos expression in the LC of a sleep-deprived rat treated with VEH, (g) ALM, or (h) ZOL. (i) Combined analysis of all scored 5HT neurons in the DR. (j) Analysis of Fos labeling in the LC for each treatment condition. Numbers in bars indicate N per group. *p<0.05 and **p<0.01 compared with the indicated treatment group.

