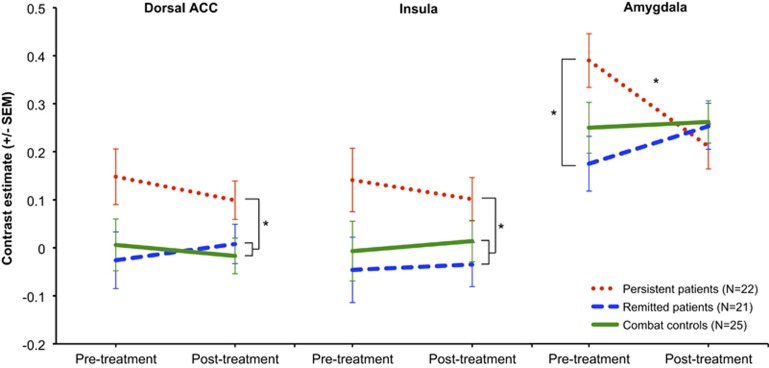
Figure 2.
Pre- and post-treatment functional magnetic resonance imaging (MRI) results. Pre- and post-treatment activation in response to negative pictures is displayed for the dorsal anterior cingulate cortex (ACC) (left panel), insula (middle panel), and amygdala (right panel). Mean contrast estimates are shown separately for persistent patients (red dotted lines), remitted patients (blue striped lines), and combat controls (green solid lines). Error bars show the SEs for each group mean. An asterisk (*) indicates a significant group difference of p<0.05.

