Fig. 1.

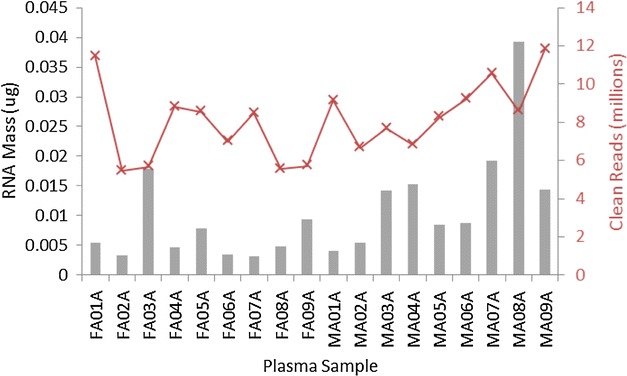
Mass of RNA obtained in micrograms from 5 mL plasma (grey bars) for each donor specimen against the number of clean sequencing reads obtained in millions (Q ≥ 30) (red crosses)

Mass of RNA obtained in micrograms from 5 mL plasma (grey bars) for each donor specimen against the number of clean sequencing reads obtained in millions (Q ≥ 30) (red crosses)