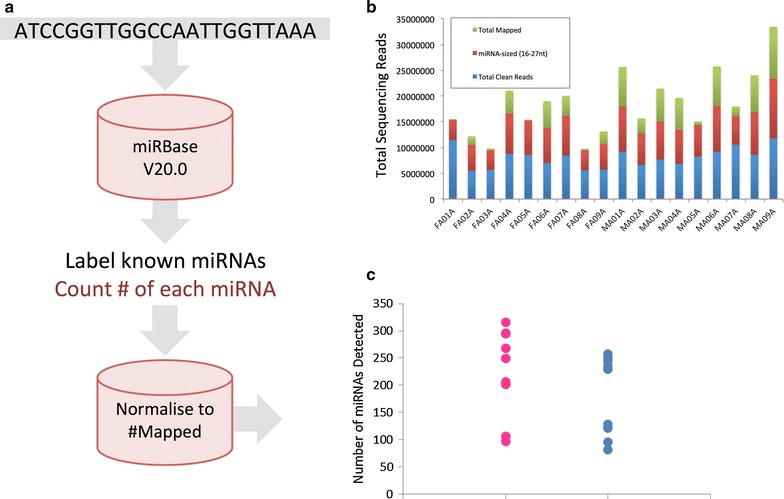
Fig. 2.

a Schematic showing the bioinformatic approach taken for miRNA sequencing and mapping. b Number of clean sequencing reads obtained in millions (Q ≥ 30) (sum of blue, red and green bar elements), total number of reads of miRNA size (sum of red and green elements) and the total number of reads mapped to miRBase (green element) for each study participant. c Total number of miRNAs mapped for each study participant sorted according to gender (blue—males, pink—females) (n = 9, N = 18). Note, only those miRNAs detected by at least ten independent sequencing reads, and that were present in at least three study participants are included
