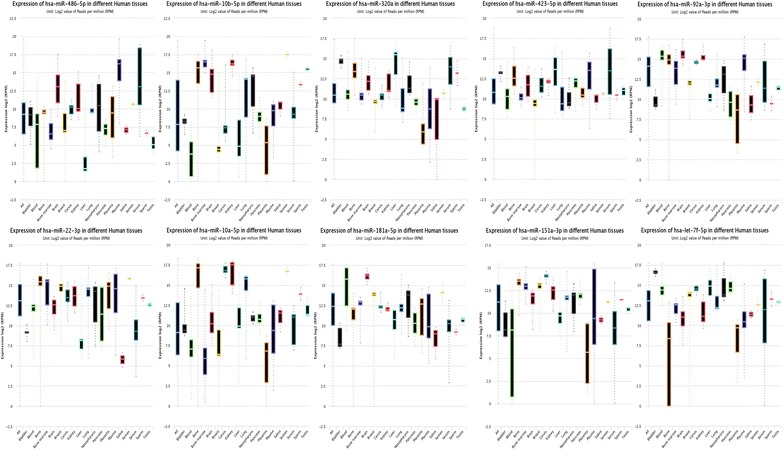
Fig. 4.

Tissue based expression data for the ten most highly expressed miRNAs detected in human plasma. Data are reads per million (RPM) in Log 2 form obtained from miRMine online (Guan Laboratory, University of Michigan). Box and whisker plots identify the minimum and maximum, upper and lower quartile and median values
