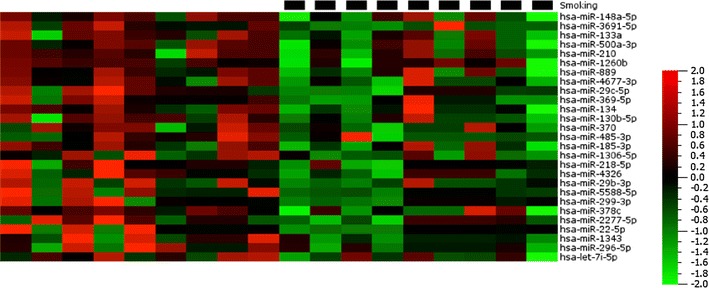
Fig. 7.

Heat map diagram showing the effects of smoking (black squares) on plasma miRNA expression. Data are normalised expression values determined by next generation sequencing, ordered by descending fold change where P < 0.05. The colour bar indicates the range of normalised expression values from −2 (green) to +2 (red)
