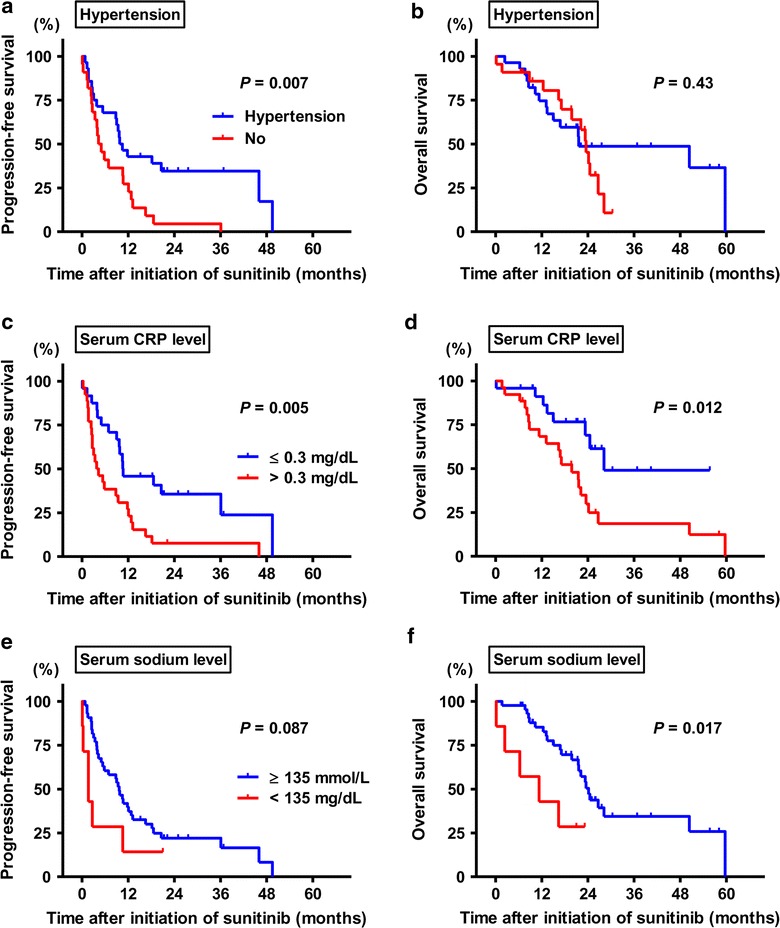
Fig. 2.

Kaplan–Meier analysis of progression-free survival (left panels) and overall survival (right panels). Kaplan–Meier estimates of survivals according to the incidence of sunitinib-related hypertension (a, b), serum level of CRP (c, d) and sodium (e, f) at baseline. The time to the events is given in months
