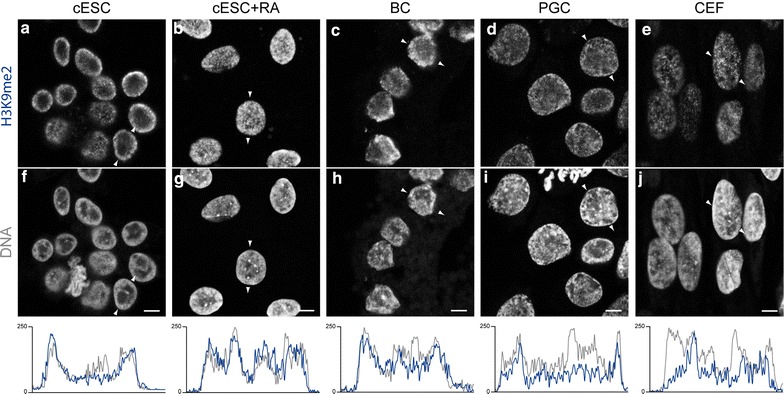
Fig. 4.

Nuclear distribution of H3K9me2 in chicken ESCs, RA-differentiated ESCs, BCs, PGCs and CEFs. Immunodetection of H3K9me2 (a–e) and DNA counterstaining with TO-PRO-3 (f–j) in nuclei of cESCs, RA-differentiated cESCs, BCs, PGCs and CEF. White arrows indicate linescan and direction of intensity plots below, showing signal for H3K9me2 (blue) and TO-PRO-3 (grey) in the equatorial section of a typical nucleus. Single confocal images of representative nuclei are shown. Scale bar 5 μm
