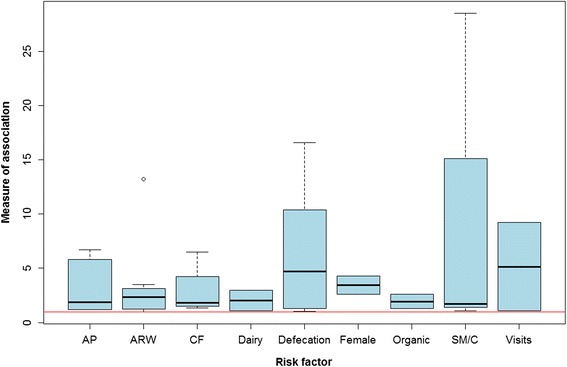
Fig. 5.

Representation of the degree of association (OR and RR) per each risk factor identified. Only factors associated with a higher risk of infection are represented. The red line sets the point along the Y-axis where the degree of association equals 1. Legend: AP, Access to pastures; ARW, Access to risky water sources; CF, Access to potentially contaminated feed; Dairy, Dairy animals; Female, Being female; Organic, Organic farming; SM/C, Sharing machinery or hiring contractors; Defecation, Proximity to uncontrolled human defecation; Visits, Having visitors on farm
