
Fig. 3.
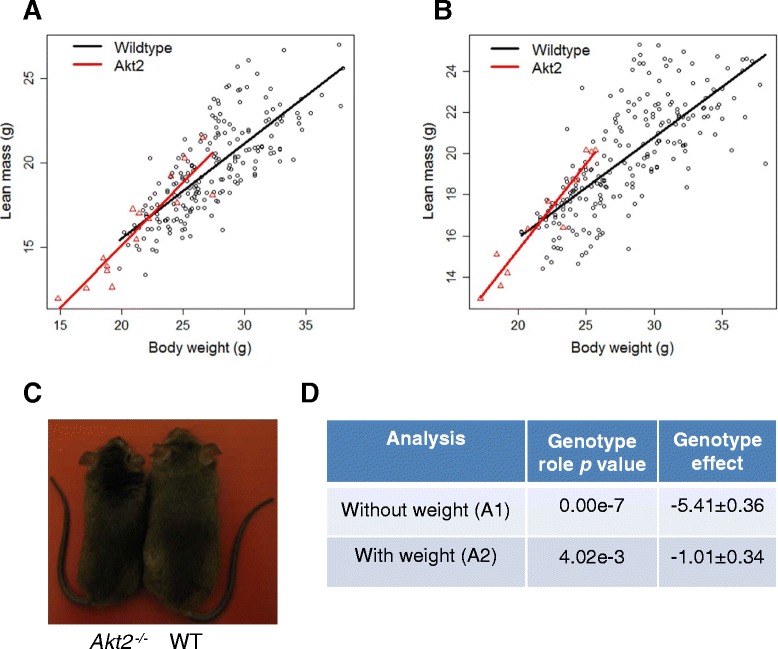
Example line Akt2, where body weight confuses the phenotype interpretation. Body composition data were collected with dual-energy X-ray absorptiometry at 14 weeks of age for the Akt2 tm1e (KOMP) Wtsi/Akt2 tm1e (KOMP) Wtsi knockout line on the 129S5/SvEvBrd/Wtsi;129S7/SvEvBrd/Wtsi genetic background. The comparison was based on 71 female and 84 male wildtype mice and 12 female and 14 male knockout mice. a A scatterplot of the lean mass readings for the wildtype and knockout animals for the males. b A scatterplot of the lean mass readings for the wildtype and knockout animals for the females. c Representative photograph demonstrating body weight phenotype. d The genotype estimate with associated standard error and statistical significance when estimated using the standard methodology (A1: Analysis Pipeline 1) and then after inclusion of body weight as a covariate (A2: Analysis Pipeline 2). The scatterplots of the lean mass against body weight highlight that there is a clear body weight phenotype and the difference between the knockouts and wildtype mice cannot be fully explained by the association between lean mass and body weight