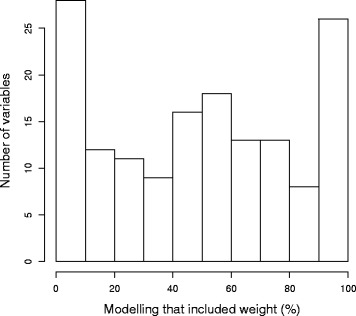
Fig. 4.

The inclusion of weight as a source of variation. The distribution of weight inclusion in the PhenStat analysis of 85086 control-knockout datasets which covers 154 variables (average number datasets = 552) from the high throughput phenotyping data collected at the WTSI MGP. The PhenStat analysis was completed using the Mixed Model framework with a starting model that included weight. The model optimisation process means that the final model will only include weight if it is statistically significant in explaining variation in the data (p < 0.05)
