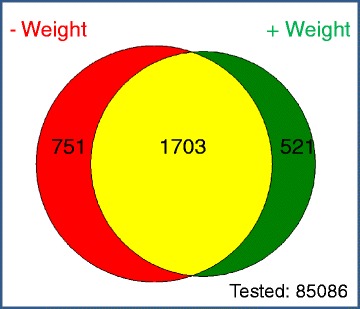
Fig. 5.

The impact of including body weight as a covariate on abnormal phenotype annotations. The relationship between the abnormal phenotype annotations made when assessing for a genotype effect by processing through A1 (standard statistical analysis pipeline) and A2 (statistical analysis including body weight as a covariate). The analysis used a mixed model method implemented within PhenStat [9] on data collected by the WTSI MGP (for more details see Additional file 1: Supplementary Methods). Shown in red are those annotations, where the phenotype difference was due to the confounding effect of body weight (row 1 of Table 1). Shown in green are those annotations where adding weight to the analysis has increased sensitivity (row 3 of Table 1). Shown in yellow are annotations made in common by both pipelines (row 4 of Table 1). Data available from Zenodo [14]
