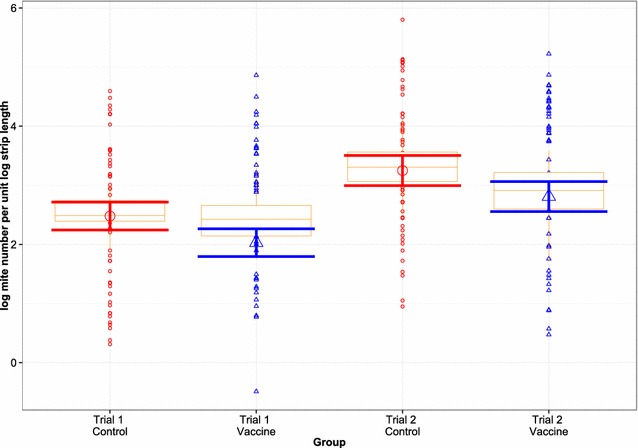
Figure 2.

Mite numbers at the leading edge of the lesion, 6 weeks post-infestation with P. ovis. Data on mite number are presented as the logarithm of mite number per log strip length (cm). The plot shows observed mite number on lambs of vaccine (triangles) and control (circles) groups accompanied with boxplots presenting summary statistics of the observed data, and estimated mean mite number on the log scale (large triangle/circle) and corresponding 95% confidence interval (error bar) for vaccine and control groups during both trials.
