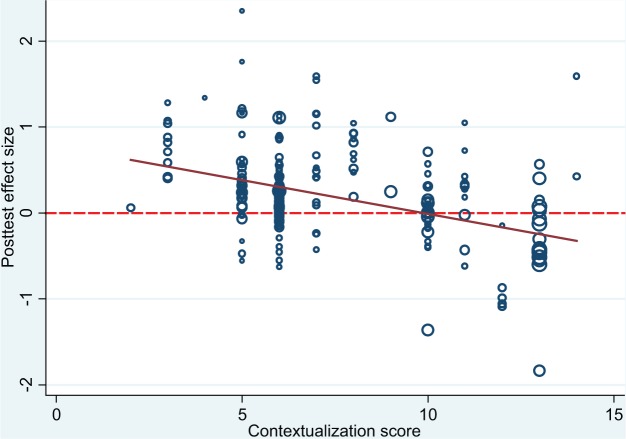
Figure 2.
Scatter plot of pretest-adjusted posttest effect sizes and overall contextualization aggregate score for digital game versus nongame conditions (media comparisons).
Note. Each effect size shown proportionate to its weight in the meta-analysis. Slope coefficient from meta-regression with robust variance estimation b = −0.07 (p = .01, 95% CI [−0.12, −0.01]).

