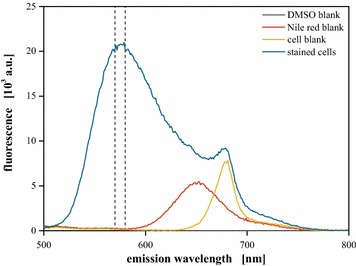
Fig. 2.

Typical fluorescence spectra of the lipid assay. Staining of cells with the lipid probe Nile red and subsequent excitation at 480 nm results in a specific, lipid correlated fluorescence with a maximum at 570–580 nm. Biomass with a biovolume of 0.15 µL mL−1 was stained for 3 h at 40 °C in 25 % (v v−1) DMSO with 1 mg L−1 Nile red, excitation at 480 nm
