
Fig. 1.
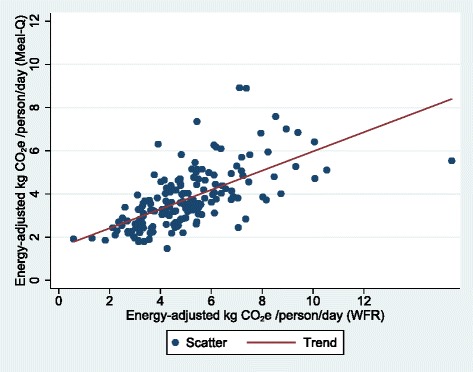
Scatter plot with energy-adjusted CO2e assessed by Meal-Q on the vertical axis and energy-adjusted CO2e assessed by WFR on the horizontal axis, for participants included in the validation analysis (n = 166). The outlier to the right is a person on a low carbohydrate high fat diet. The scatter plot for crude CO2e was similar (see Additional file 1: Fig. S1). CO2e, carbon dioxide equivalents. WFR, weighed food record