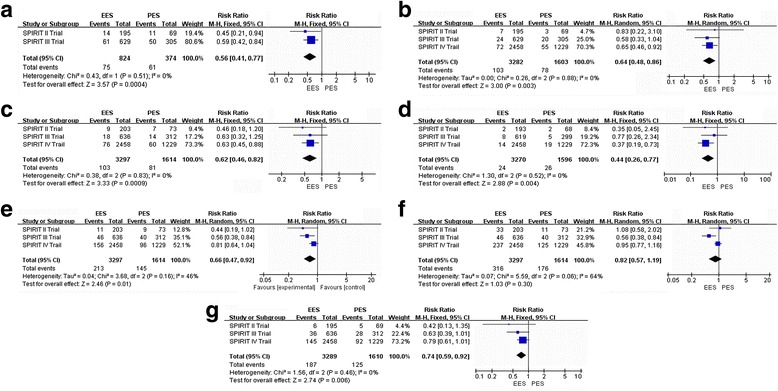
Fig. 4.

Risk Ratio of 3-year clinical outcomes: the Risk Ratio of (a: MACE, b: MI, c: all cause of death; d: ST; e: TLR, f: TVR, g: ID-TLR) at 3-year follow-up associated with EES versus PES

Risk Ratio of 3-year clinical outcomes: the Risk Ratio of (a: MACE, b: MI, c: all cause of death; d: ST; e: TLR, f: TVR, g: ID-TLR) at 3-year follow-up associated with EES versus PES