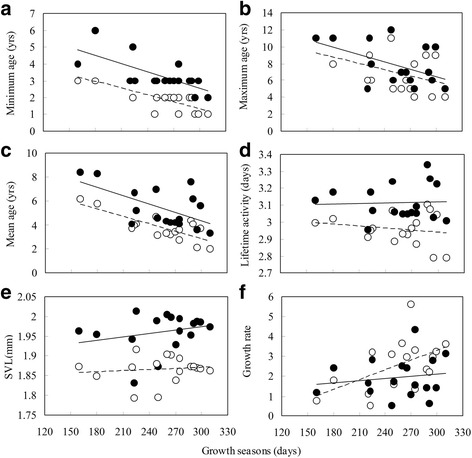
Fig. 3.

Relationships between length of growth seasons and minimum age (a), Maximum age (b), mean age (c) and lifetime activity (d), body size (e) and growth rate (f) in Bufo andrewsi. Solid lines (filled circles): females; dashed line (open circles): males. Data points are female and male population means. Statistical details are as in Table 1
