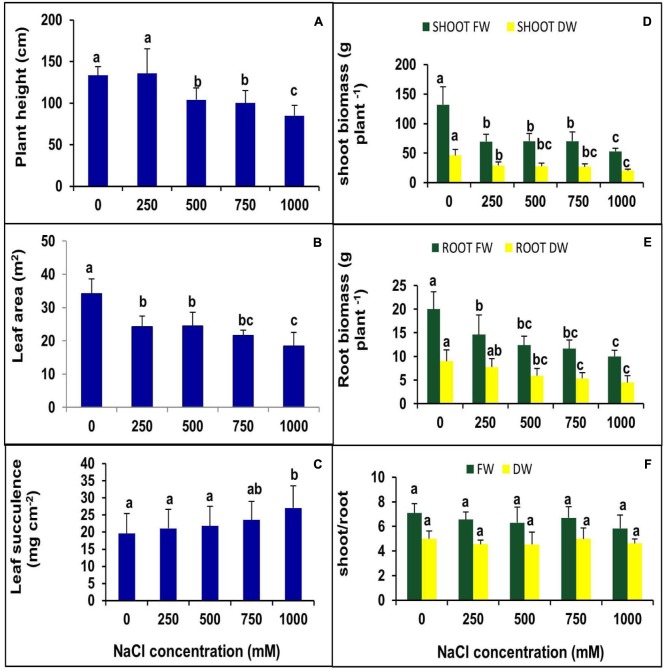
FIGURE 2.
Effects of various levels of NaCl on (A) plant height; (B) leaf succulence; (C) leaf area (LA); (D) shoot biomass; (E) root biomass; (F) shoot/root ratio of S. persica seedlings. The values are mean ± SD (n = 6). The different letters on the top of the error bars indicate statistically different means at P ≤ 0.05.

