FIGURE 3.

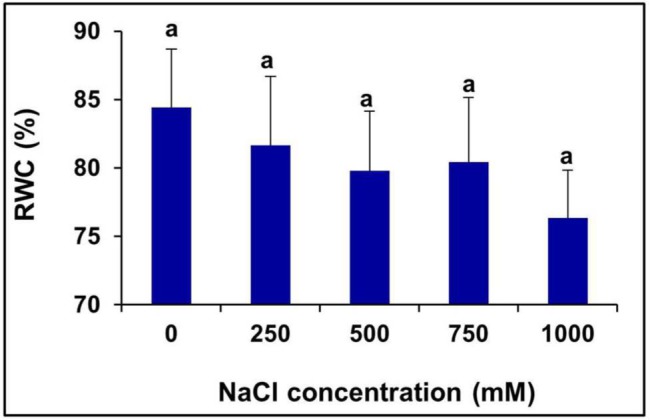
Salinity induced changes in the leaf RWC % of S. persica. The values are mean ± SD (n = 6). The different letters on the top of the error bars indicate statistically different means at P ≤ 0.05.

Salinity induced changes in the leaf RWC % of S. persica. The values are mean ± SD (n = 6). The different letters on the top of the error bars indicate statistically different means at P ≤ 0.05.