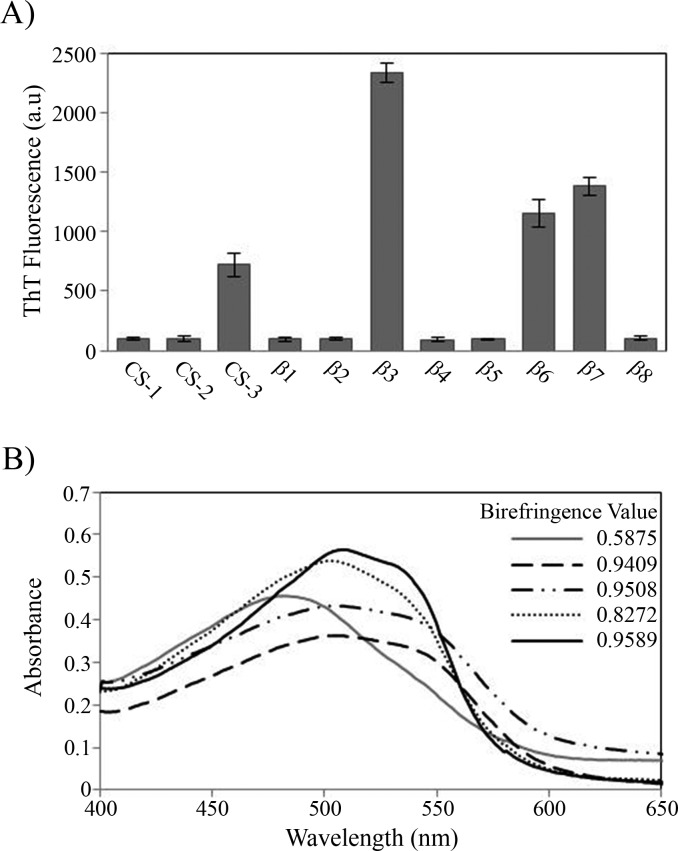
Figure 4. Peptide aggregation.
(A) ThT fluorescence intensities at 485 nm of aggregates of peptides at final time point of incubation. (B) Congo red birefringence assay of the β3 (solid black line), β6 (dashed line), β7 (dotted-dashed line) and CS-3 (dotted line) aggregates. A maximal peak at 540 nm is shown in aggregates compared with Congo red alone (solid gray line).

