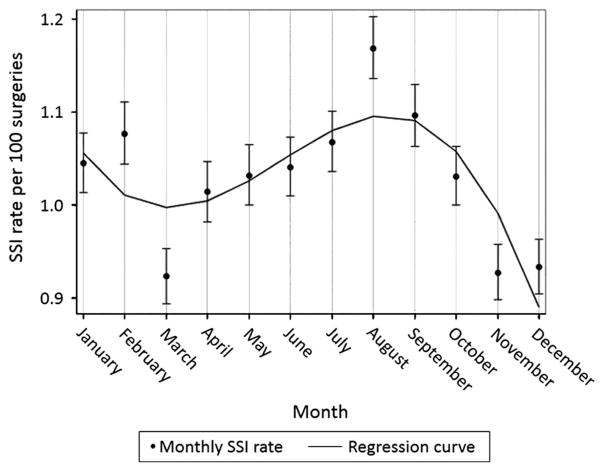
Figure 1.
Surgical site infection (SSI) prevalence rate per 100 procedures by month for all organisms and common procedures. Polynomial regression analysis resulted in a best-fit line that shows statistically significant seasonal variation with the highest SSI prevalence rate during the summer months.

