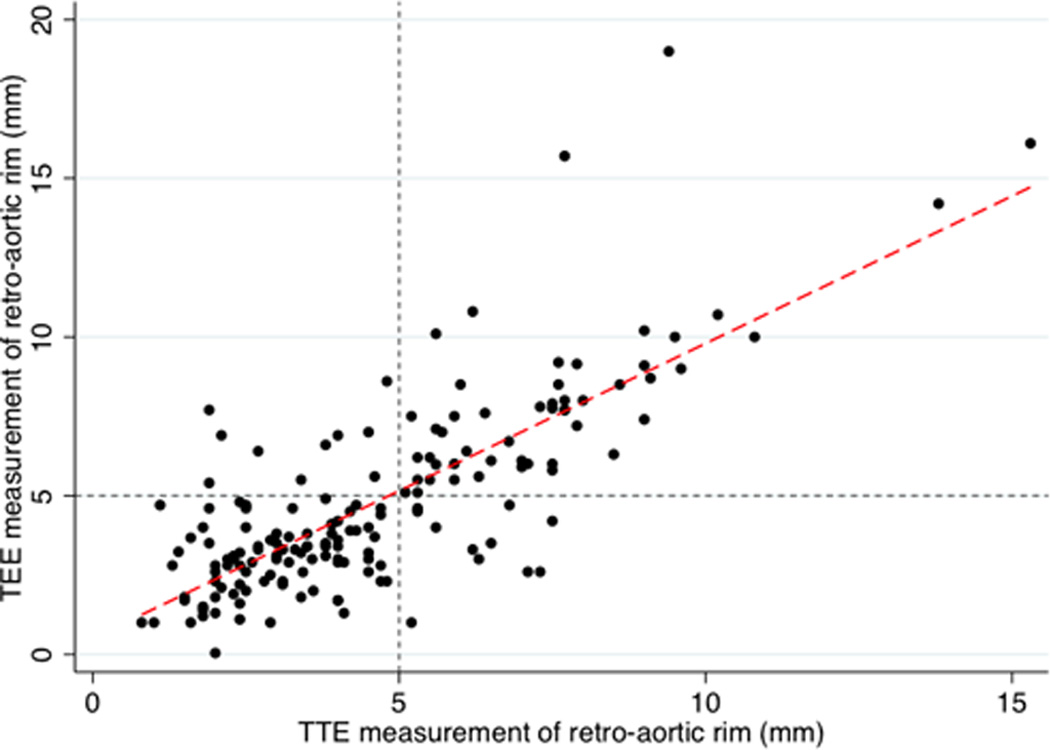
Figure 2. TTE vs. TEE measurement of retro-aortic rim.

Individual level data for both measurements of retro-aortic rim are plotted (circles). Regression line is plotted (red dash) beta=0.9, r2=0.6, p<0.001.
Gray small dashes mark retro-aortic rim of 5 mm for TTE (vertical line) and TEE (horizontal line). These divide the grid into quadrants representing the relative distribution of accurate and inaccurate classification of aortic rim. Observations in lower left quadrant represent true positives for deficient retro-aortic rim, while those in the upper right quadrant are true negatives for rim deficiency (i.e. true positives for sufficient retro-aortic rim). Observations in the upper left quadrant (false positive) and lower right (false negative) represent inaccurate classification of retro-aortic rim by TTE measurement.
