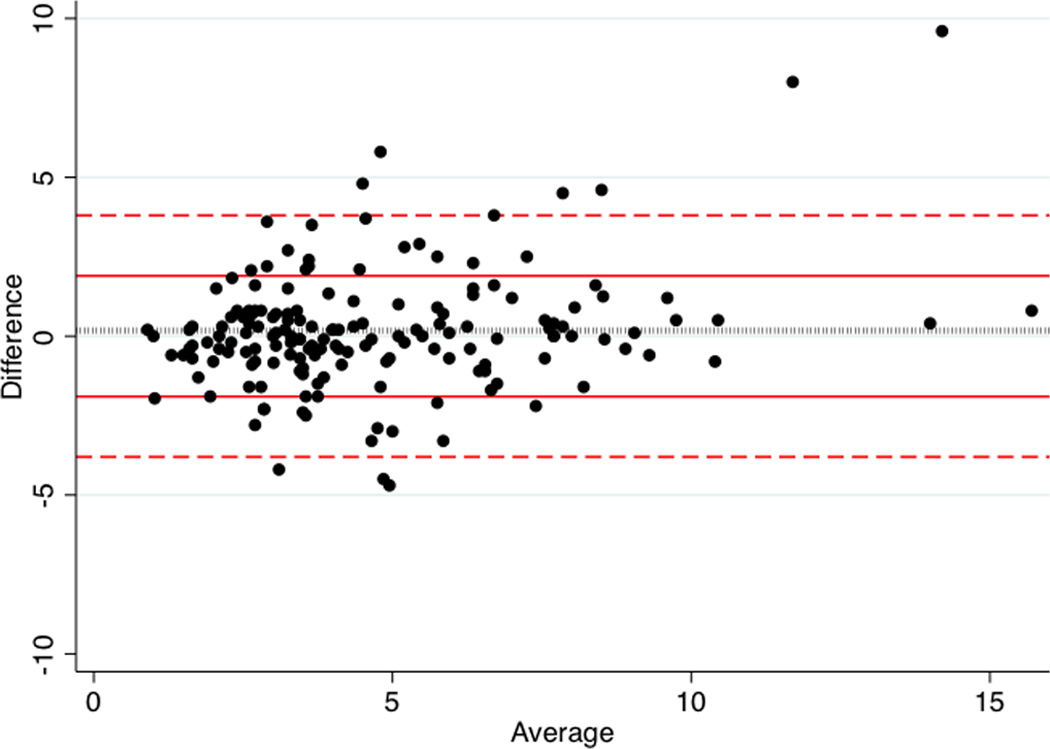
Figure 3. Bland-Altman plot of TTE vs. TEE measurement of retro-aortic rim.

Average of TTE and TEE measurements (x-axis) and difference between TTE and TEE measurements (y-axis) are plotted for each subject (black circle). Bounds for one (red solid lines) and two standard deviations (red dashed lines) for difference are plotted, as is the mean difference between TTE and TEE (black dotted line). Limits of agreement are −4.0 to 3.7. Mean difference is −0.18±1.9mm (95% CI: 0.47–0.12).
