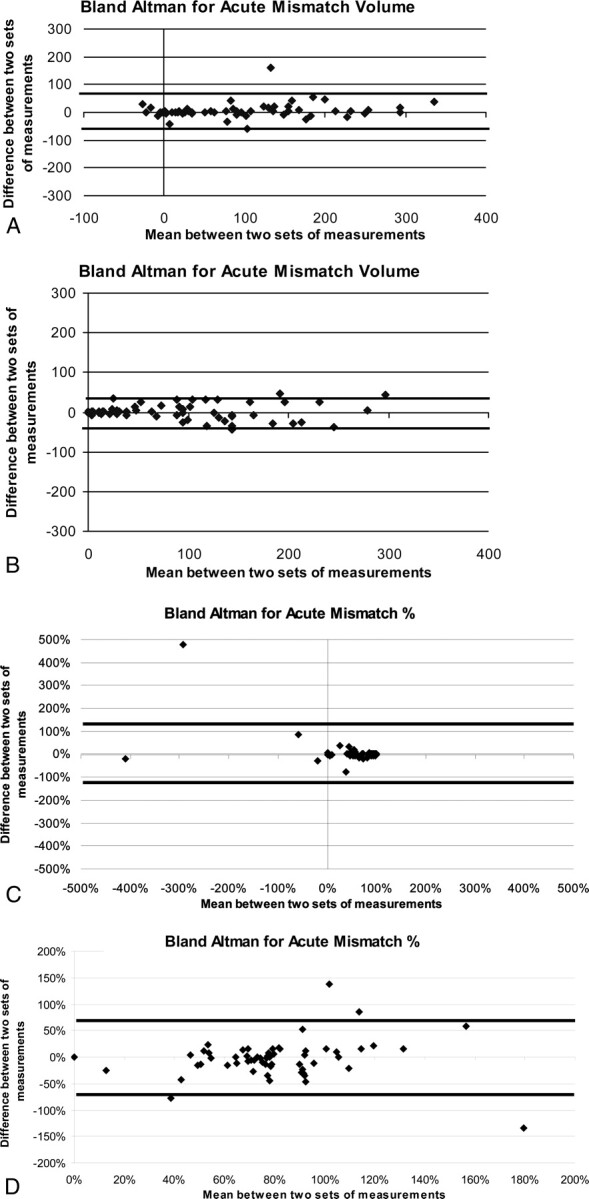
Fig 2.

A, Mismatch Method 1, acute time point plot of mean volume vs volume difference between 2 sets of measurements (raw numbers) where the thick black lines represent the upper and lower boundaries using ±2 SDs from the mean. B, Mismatch Method 2, acute time point plot of mean volume vs volume difference between 2 sets of measurements (raw numbers) where the thick black lines represent the upper and lower boundaries using ±2 SDs from the mean. C, Mismatch Method 1, acute time point plot of mean percentage vs percentage difference between 2 sets of measurements (mismatch/MTT percentage) where the thick black lines represent the upper and lower boundaries using ±2 SDs from the mean. D, Mismatch Method 2, acute time point plot of mean percentage vs percentage difference between 2 sets of measurements (mismatch/MTT percentage) where the thick black lines represent the upper and lower boundaries using ±2 SDs from the mean.
