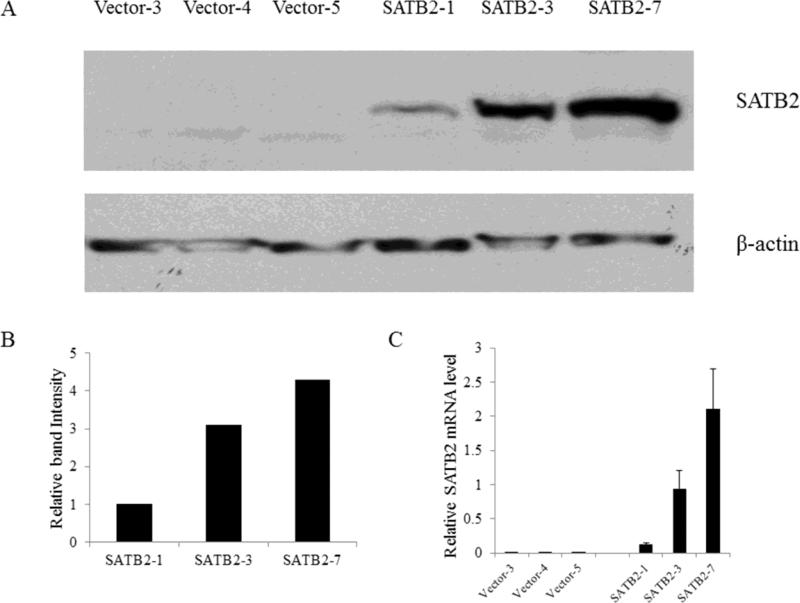
Figure 1.
SATB2 expression in selected vector and SATB2 stably-transfected BEAS-2B cell clones. (A). Western blot analysis of SATB2 levels in SATB2-overexpressing cell clones compared with control clones. (B).The intensity of individual band in the western blot was quantified using Image J software and expressed relative to β-actin signal as a control. (C).The relative level of SATB2 mRNA was evaluated by real-time PCR.

