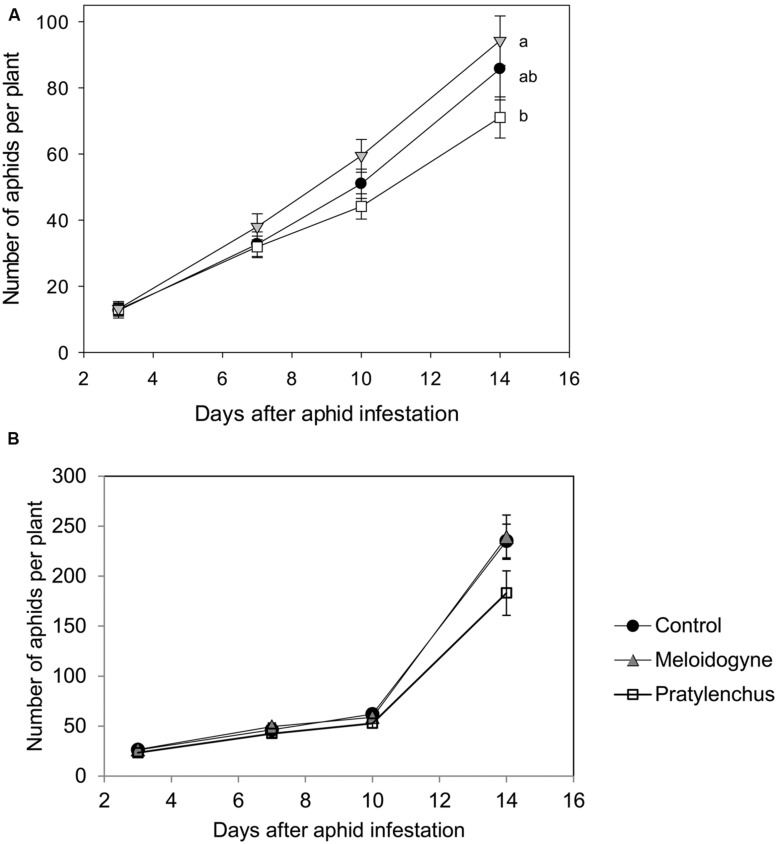
FIGURE 1.
Average numbers of aphids (+SE) on plants infested with Pratylenchus penetrans (white squares), Meloidogyne incognita (gray triangles) or mock infested with water (black circles). (A) Aphid population development in the greenhouse experiment. n = 20–22 Different letters indicate significant differences in aphid population development (Repeated measures ANOVA followed by contrast analysis). (B) Aphid numbers in a simulation experiment, parameterized to resemble the greenhouse experiment in 1A.

