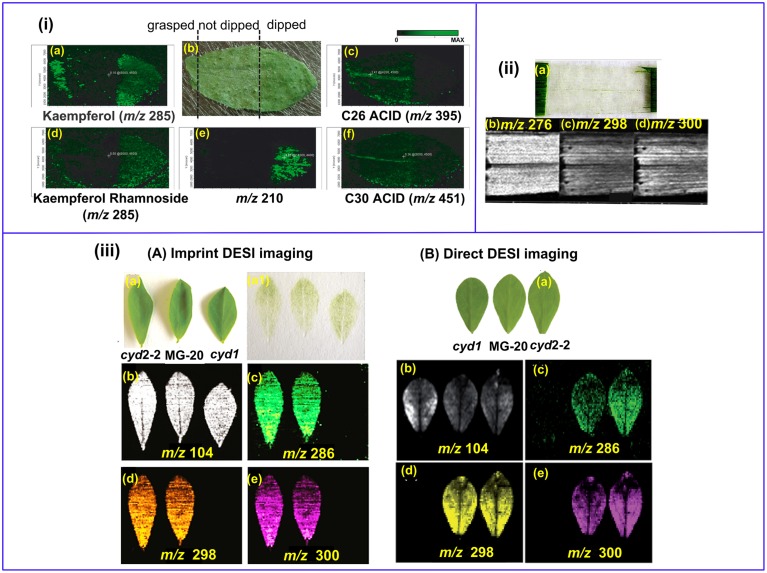
Figure 4.
MS imaging of metabolites below the cuticle. (i) MALDI imaging of Arabidopsis leaf. The left area of the leaf was grasped using forceps, the middle part remained un-treated and the right area was chloroform-dipped (b); Kaempferol (a) and Kaempferol Rhamnoside (d) were readily detected in the forceps- grasped and chloroform-dipped areas, while C26 (c) and C30 (f) fatty acids were washed off in the chloroform-dipped area. An un-identified analyte m/z = 210 (d) showed high abundance in the chloroform-dipped area. (ii) DESI images of the hydroxynitrile glucosides of m∕z = 276 (b), 298 (c) and 300 (d) from barley leaf epidermis. The leaf abaxial epidermis strip was physically peeled off (a). (iii) Comparison of imprinting and direct DESI imaging of L. japonicus leaves. (A) Indirect DESI imaging of the leaf imprint on Teflon. (B) Direct DESI imaging of the leaf, with chloroform, methanol and water (1:1:0.4, v/v/v) as spray solvent. (a) Optical image of L. japonicus leaves. (a1) Optical image of the leaf imprints on Teflon. (b–e) DESI images of m/z 104, 286, 298, and 300, respectively. Figures were adapted with the permission from Cha et al. (2008), Li et al. (2011, 2013), and Bjarnholt et al. (2014), respectively.

