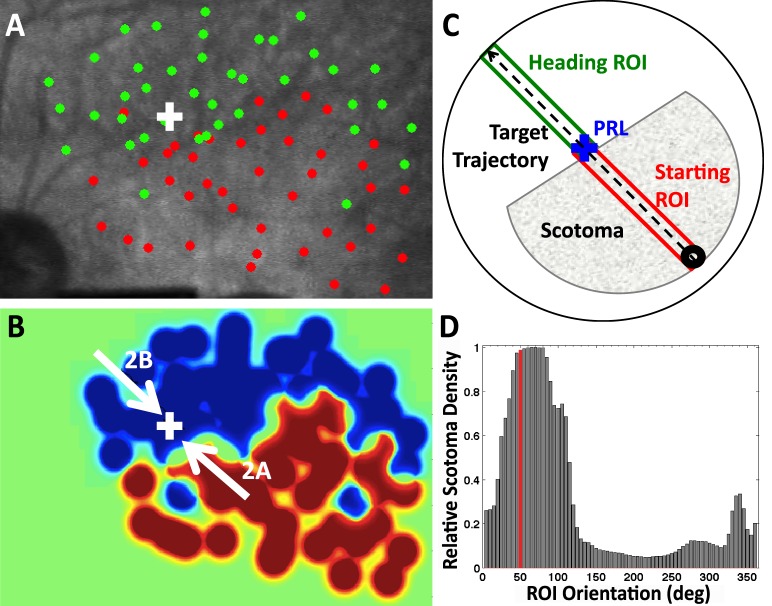
Figure 1.
(A) SLO perimetry for left eye of P4. (B) Heat map corresponding to the map in A. White arrows represent target directions of trials shown in Figure 2. (C) Schematic for estimating scotoma extent along target trajectory. The shaded area is a cartoon representation of the scotoma in B, and the blue cross is fixation. The dashed arrow is target trajectory. The green and red rectangles represent the Heading region of interest (ROI) where the target is heading and Starting ROI, where target motion originates. (D) Scotoma extent (fraction of red pixels to total number of pixels in an ROI rectangle) for all ROI orientations. The ROI in C is highlighted in red.

