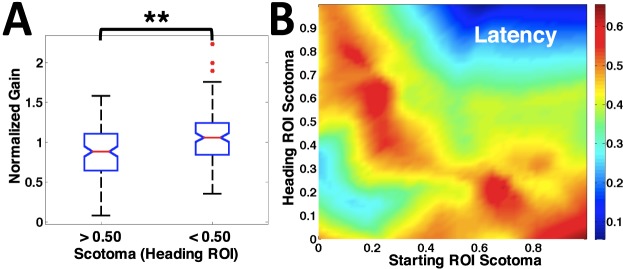
Figure 5.
(A) Normalized pursuit gain distribution for Heading ROIs with scotoma extent greater versus less than 50%. The gains are significantly higher for scotoma extent <50% (p = 0.001). (B) Latency versus scotoma extent in Starting and Heading ROIs. Latency increased with scotoma extent in Starting or Heading ROIs (red) but was low (blue) when scotoma was extensive in both.

