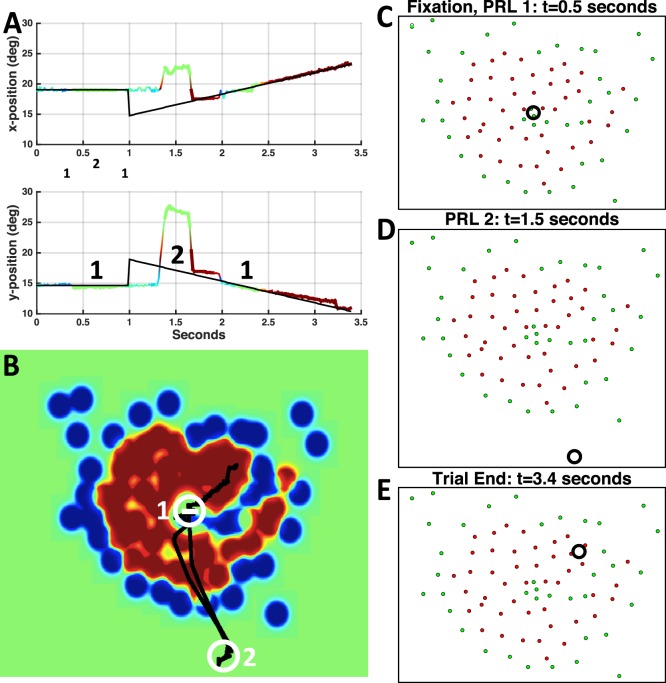
Figure 7.
(A) Representative horizontal (top) and vertical (bottom) traces from P5. Regions labeled 1 represent period where fixational PRL was on target. Region labeled 2 represents a second PRL, labeled in B. (B) Heat map showing P5's scotoma region (red) with both PRLs labeled. Black line shows target trajectory across the eye. (C–E) Location of the target (Black Circle, to scale) relative to the scotoma (Red Dots) during fixation (C), pursuit with a peripheral PRL (D), and pursuit at the end of the trial (E).

