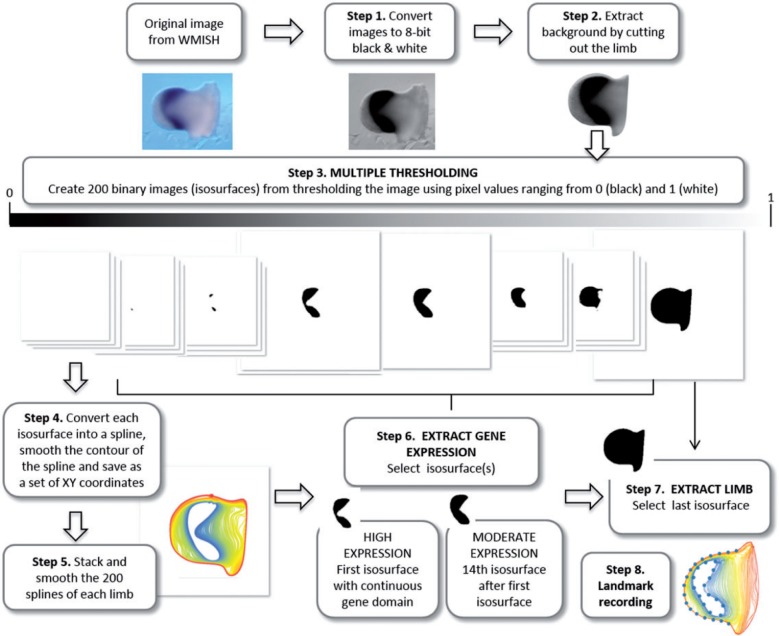
Figure 2.
Schematic pipeline of limb bud shape extraction and multiple thresholding of gene expression domains. In the first step of the multiple thresholding method, the original WISH images are converted into eight-bit grayscale images. The second step is to remove the background of the image by cutting out the limb. In step 3 the resulting image undergoes multiple thresholding: the image is automatically thresholded using 200 different values ranging from 0 (i.e. black pixel values) to 1 (i.e. white pixel values). Black pixels represent very high gene expression, whereas light gray represent very low gene expression. As a result 200 binary images are generated. The whole sequence of binary thresholded images (from now on called isosurfaces) captures the decreasing intensity of gray pixel values in the segmented limb images. In step 4 each isosurface is converted into a spline and saved as a set of xy coordinates. The fifth step stacks the 200 splines representing each limb and smoothes them to remove undesirable irregularities caused by high resolution automated spline extraction. The splines were smoothed by iteratively applying 25 times the smoothout function in R (Claude 2008), a procedure based on Haines and Crampton (2000) that reduces measurement error by averaging the xy coordinates of neighboring points. Note that when a gene is expressed as a gradient, many isosurfaces represent the expression domain and in step 6 the user needs to choose which level/s to analyze. We discarded the first isosurfaces containing scattered irregular patches with very strong gene expression, and selected as high gene expression level the first isosurface representing a continuous gene domain (step 6). Depending on the staining and the quality of the image, the number in sequence of the isosurface representing the high expression domain for each limb is different, but represents a homologous gene domain across the sample. As moderate expression we selected the 14th isosurface after the first one (step 6). The following isosurfaces representing very low levels of gene expression captured noisier signals of gene domains and were thus not considered for analysis. In step 7, the last isosurface is selected to extract limb bud shape. The isosurfaces representing the high and moderate gene expression domains and the limb bud are the starting point for the shape analysis, which begins in step 8 by recording landmarks on both the limb and the gene outlines. 208 × 174 mm (300 × 300 DPI).

