
Figure 6. Cell clustering induced by perlecan Dm IV-3 and reversed by MMP-7.
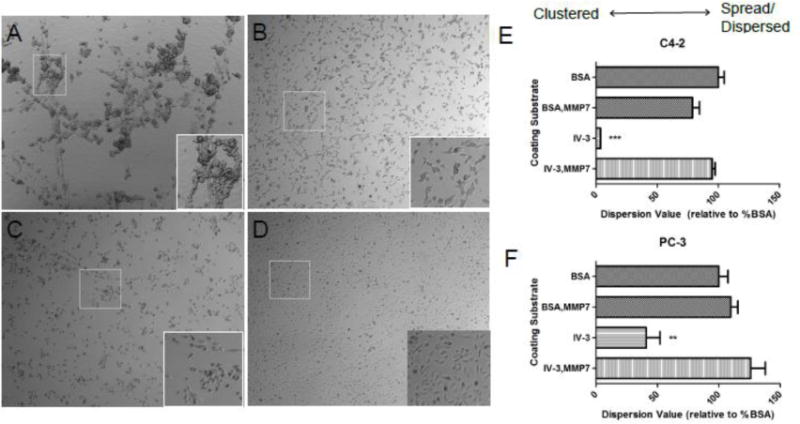
C4-2 (A, B) and PC-3 PCa cells (C, D) seeded on adsorbed Dm IV-3 (A, C) or Dm IV-3 pre-digested with MMP-7 (B, D). Cell clustering occurred for both cell types on Dm IV-3 but was reversed with MMP-7 digestion. Quantification of cell dispersion is shown for C4-2 (E) and PC-3 (F) cells on various matrix types. A lower value is indicative of cell clustering. A *** indicates a p value <0.005 and ** is a p value <0.01 in comparison to Dm IV-3 + MMP-7 using an unpaired student’s t-test.