
FIGURE 1.
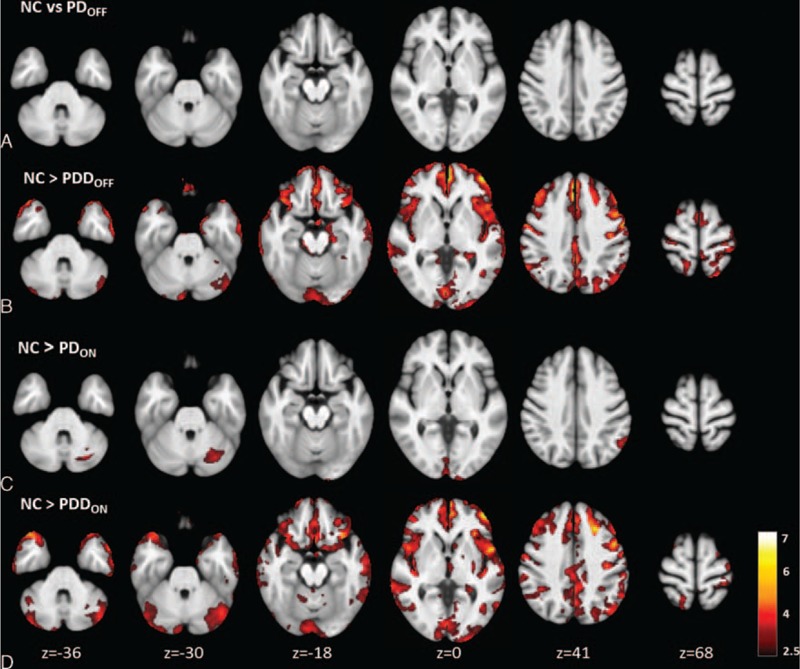
Regions with significantly decreased absolute cerebral blood flow in Parkinson disease and Parkinson disease with dementia patients in the ON and OFF status compared with healthy controls (cluster level statistics, P value < 0.05, family-wise error corrected). The color bar indicates the T scores scale.