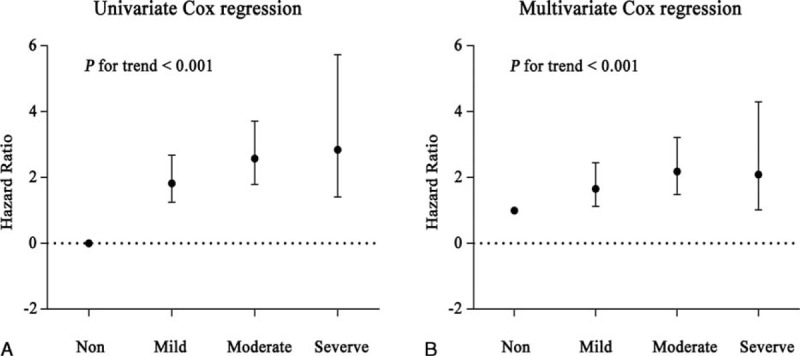
FIGURE 3.

Hazard ratio of varying degree of on admission anemia. (A) Hazard ratio of varying degree of on admission anemia calculated by univariate Cox proportional regression, severe anemia had higher HR than nonanemia (P for trend <0.001). (B) Hazard ratio of varying degree of on admission anemia calculated by multivariate Cox proportional regression, adjusting variables in Table 4. Severe anemia had higher HR than nonanemia (P for trend <0.001).
