
FIGURE 2.
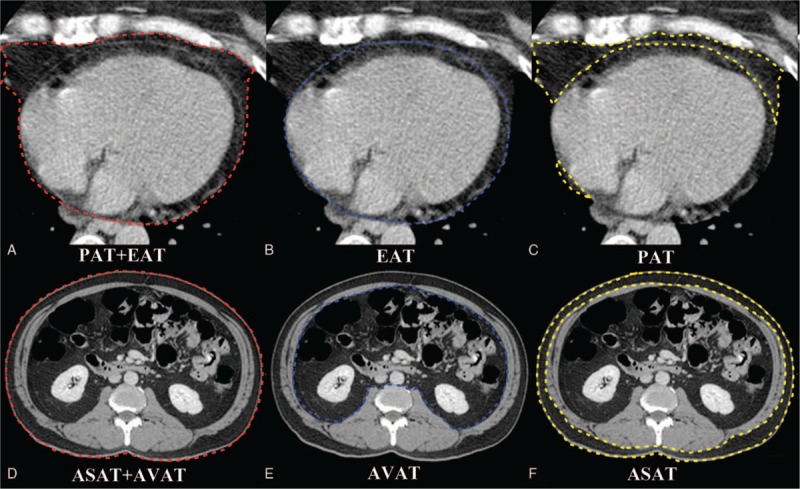
Quantification of different fat deposits by CT. Total pericardial volume = total EAT volume + total PAT volume. (A–C) Measurement of total EAT volume was performed on axial images by manual tracing (blue boundary) of the parietal pericardium from the left main pulmonary artery level to the left ventricular apex. Measurement of total pericardial fat volume by manual tracing (red boundary) of the area of the pericardial fat from the left main pulmonary artery level to the left ventricular apex. Total PAT volume (yellow boundary) = total pericardial fat volume (PAT + EAT) − total EAT volume. (D–F) Measurement of total AVAT volume was performed on axial images by manual tracing (blue boundary) of the parietal peritoneum from L2 to L5 levels. Measurement of total abdominal fat volume by manual tracing (red boundary) of the area of the abdominal fat from L2 to L5 levels. Total ASAT volume (yellow boundary) = total abdominal fat volume (AVAT + ASAT) − total AVAT volume. ASAT = abdominal subcutaneous adipose tissue, AVAT = abdominal visceral adipose tissue, EAT = epicardial adipose tissue, PAT = paracardial adipose tissue.