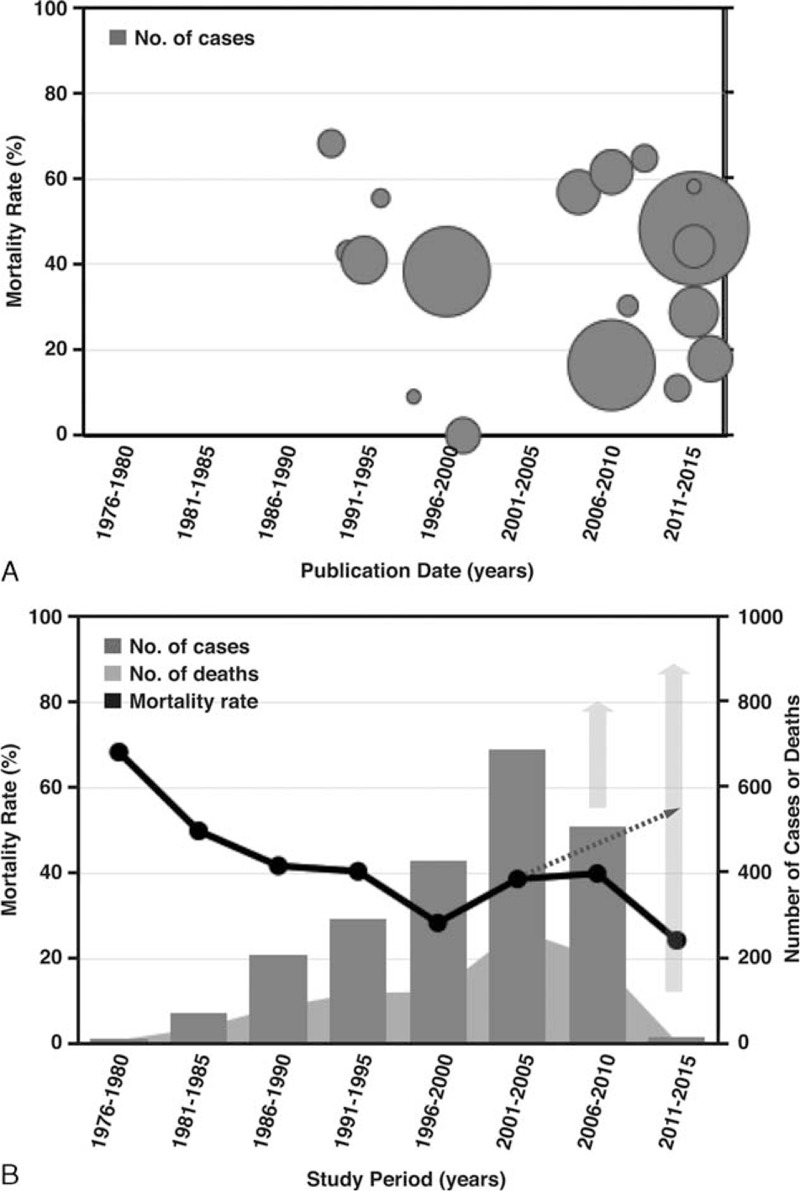
FIGURE 3.

Temporal distribution of the reported episodes of Vibrio vulnificus necrotizing skin and soft tissue infections according to (A) publication date and (B) study period. Note: the size of the circles in (A) indicates the reported number of cases in different studies. In (B), the solid gray arrows represent the recruited case numbers from the expected studies in the future and the dashed arrow the projection of mortality based on the actual recorded mortality from 1996 to 2005.
