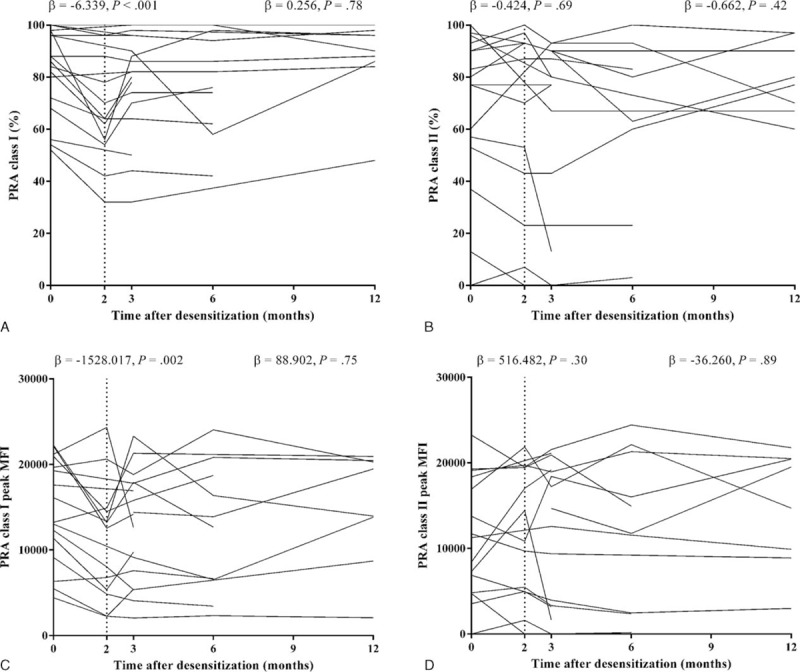
FIGURE 3.

Changes of PRA after desensitization. A, The serial measurements of percent values of PRA class I after desensitization. B, The serial measurements of percent values of PRA class II after desensitization. C, The serial measurements of peak MFI values of PRA class I after desensitization. D, The serial measurements of peak MFI values of PRA class II after desensitization. Vertical dashed line indicates the time point of 2 months after desensitization. Text values located at the left side of the vertical dashed line indicate linear regression coefficient of PRA change and P value for comparison between baseline and 2 months after desensitization. Text values located at the right side of vertical dashed line indicate linear regression coefficient of PRA change and its P value for comparing between 2 and 12 months after desensitization. MFI = mean fluorescence intensity, PRA = panel reactive antibodies.
